Create a bar chart using Rechart in ReactJS; in this article, I will explain how to create a bar chart using the Rechart library in ReactJS, Recharts provides many types of charts to display a data, line charts, bar charts, dotted line charts, pie chart, area chart, etc.
Today we will learn bar charts, to create a bar chart we need a dataset with x and y coordinate data, Recharts library provides a BarChart component we just need to prepare the dataset and pass it into the BarChart component
You can download the working example of a line chart using Recharts in ReactJS Tutorial https://github.com/technostuf/bar-chart-app
- Step 1 – Create a React application
- Step 2 – Install Recharts library
- Step 3 – Add code to the file
- Step 4 – Run a React application
Step 1 – Create a React application
Create a React app using the below command
npx create-react-app bar-chart-appAfter running the above command system will create a new folder “bar-chart-app” so you need to move into that folder, use the below command to change the directory
cd bar-chart-appStep 2 – Install Recharts library
Rechart library will be used for creating a bar chart so we need to first install this library, copy the below command and run your terminal
npm install --save rechartsStep 3 – Add code to the file
Open the App.js file and add the below code in your file to create a bar chart
import "./styles.css";
import React from "react";
import {
  BarChart,
  Bar,
  XAxis,
  YAxis,
  CartesianGrid,
  Tooltip,
  Legend
} from "recharts";

const data = [
  {
    name: "Jan",
    buy: 4000,
    sell: 2400,
  },
  {
    name: "Feb",
    buy: 3000,
    sell: 1398,
  },
  {
    name: "Mar",
    buy: 2000,
    sell: 9800,
  },
  {
    name: "Apr",
    buy: 2780,
    sell: 3908,
  },
  {
    name: "May",
    buy: 1890,
    sell: 4800,
  },
  {
    name: "Jun",
    buy: 2390,
    sell: 3800,
  },
  {
    name: "Jul",
    buy: 3490,
    sell: 4300,
  },
  {
    name: "Aug",
    buy: 3490,
    sell: 4300,
  },
  {
    name: "Sep",
    buy: 3490,
    sell: 4300,
  },
  {
    name: "Oct",
    buy: 3490,
    sell: 4300,
  },
  {
    name: "Nov",
    buy: 3490,
    sell: 4300,
  },
  {
    name: "Dec",
    buy: 3490,
    sell: 4300,
  }
];

export default function App() {
  return (
    <>
    <h1>React - Bar chart using Rechart - technostuf.com</h1>
    <BarChart
      width={800}
      height={400}
      data={data}
      margin={{
        top: 5,
        right: 30,
        left: 20,
        bottom: 5
      }}
    >
      <CartesianGrid strokeDasharray="3 3" />
      <XAxis dataKey="name" />
      <YAxis />
      <Tooltip />
      <Legend />
      <Bar dataKey="buy" fill="#8884d8" />
      <Bar dataKey="sell" fill="#82ca9d" />
    </BarChart>
    </>
  );
}
Step 4 – Run a React application
Run the React application using the following command
npm startAfter compilation, the program opens your browser and run http://localhost:3000/
Output:
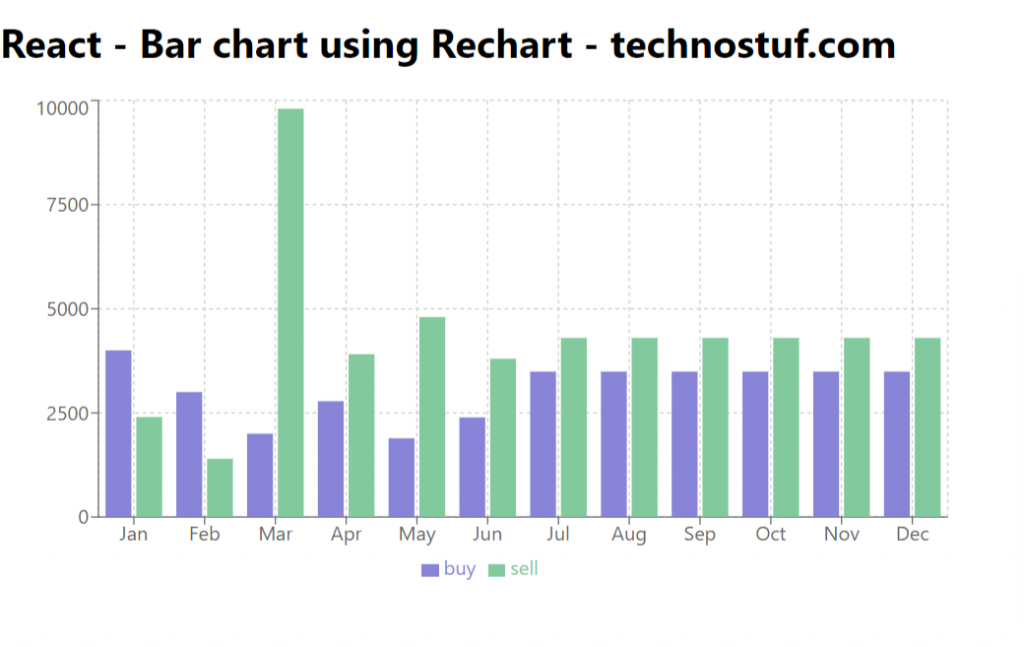
You can download the working example of a baar chart using Recharts in ReactJS Tutorial
https://github.com/technostuf/bar-chart-app
Related Post
- React Material UI Form example
- React Material UI Autocomplete with getting selected value
- React Area chart using recharts example
- React Pie chart using recharts with legend and custom label
- React google maps draggable marker example
- React datepicker using the most popular react-datepicker library
- React toast notification using react-toastify with example
- React responsive carousel slider with react-slick
- React tooltip using rc-tooltip with example
- React hook form schema validation using yup