Recharts pie chart example; In this article, I will explain how to create a pie chart using the Rechart library in ReactJS, This library is used to build various types of charts in ReactJS like Line charts, Pie charts, and Area charts, etc…
Today we will learn pie charts, to create a pie chart we need a dataset with label and value data, Recharts library provides a PieChart component we just need to prepare the dataset and pass it into the PieChart component.
You can download the working example of recharts pie chart example https://github.com/technostuf/react-pie-chart-example
Step 1 – Create a React application
Create a React app using the below command
create-react-app react-pie-chart-exampleAfter running the above command system will create a new folder “react-pie-chart-example” so you need to move into that folder, use the below command to change the directory.
cd react-pie-chart-exampleStep 2 – Install Recharts library
Rechart library will be used for creating a pie chart so we need to first install this library, copy the below command and run your terminal
npm install --save rechartsStep 3 – Add code to the file
Create a PieChartComponent.js component file to hold pie chart code separate from another component and put the below code into that file
import React, { useState } from "react";
import { PieChart, Pie, Legend, Sector, Cell, ResponsiveContainer } from 'recharts';


const PieChartComponent = () => {

    const data = [
        { name: 'Tea', value: 400 },
        { name: 'Coffee', value: 300 },
        { name: 'Cola', value: 300 },
        { name: 'Water', value: 200 },
    ];

    const COLORS = ['#0088FE', '#00C49F', '#FFBB28', '#FF8042'];

    const RADIAN = Math.PI / 180;
    const renderCustomizedLabel = ({ cx, cy, midAngle, innerRadius, outerRadius, percent, index }) => {
        const radius = innerRadius + (outerRadius - innerRadius) * 0.5;
        const x = cx + radius * Math.cos(-midAngle * RADIAN);
        const y = cy + radius * Math.sin(-midAngle * RADIAN);

        return (
            <text x={x} y={y} fill="white" textAnchor={x > cx ? 'start' : 'end'} dominantBaseline="central">
                {`${(percent * 100).toFixed(0)}%`}
            </text>
        );
    };

    return (
        <>
            <div>
                <div class="row d-flex justify-content-center text-center">
                    <h1>Favorite Beverages - technostuf.com</h1>
                    <hr />
                    <div className="col-md-8">
                        <ResponsiveContainer width={400} height={400} className="text-center">
                            <PieChart width={400} height={400}>
                                <Legend layout="vertical" verticalAlign="top" align="top" />
                                <Pie
                                    data={data}
                                    cx="50%"
                                    cy="50%"
                                    labelLine={false}
                                    label={renderCustomizedLabel}
                                    outerRadius={80}
                                    fill="#8884d8"
                                    dataKey="value"
                                >
                                    {data.map((entry, index) => (
                                        <Cell key={`cell-${index}`} fill={COLORS[index % COLORS.length]} />
                                    ))}
                                </Pie>
                            </PieChart>
                        </ResponsiveContainer>
                    </div>
                </div>
            </div>
        </>
    )
}
export default PieChartComponent;
After adding a code in PieChartComponent, you have called this component file into your code, in my case I am adding it to App.js.
import './App.css';
import PieChartComponent from './PieChartComponent';

function App() {
  return (
    <div className="App">
      <PieChartComponent />
    </div>
  );
}
export default App;
Run a React application
Run the React application using the following command.
npm startAfter compilation, the program opens your browser and runs http://localhost:3000/
Output
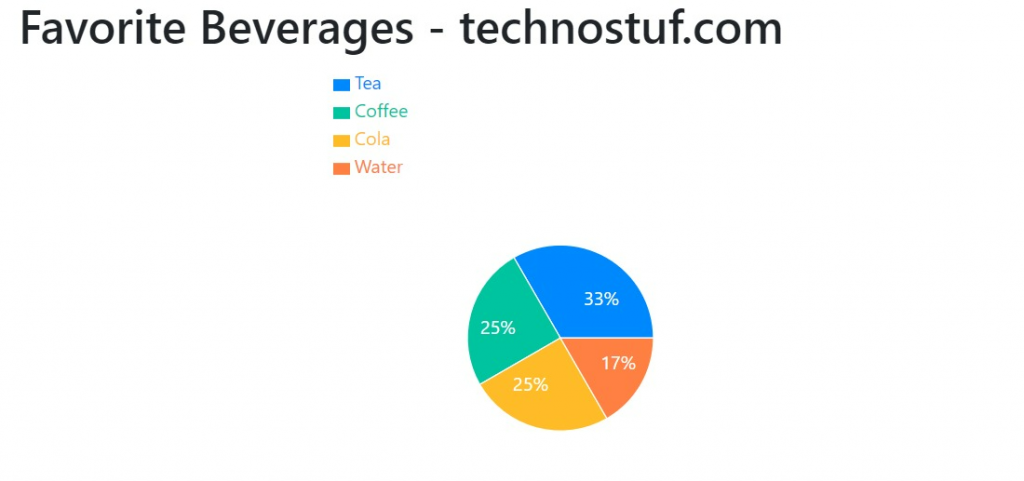
You can download the working example of recharts pie chart example
https://github.com/technostuf/react-pie-chart-example
Related Post
- React Material UI Form example
- React Material UI Autocomplete with getting selected value
- React Area chart using recharts example
- React Pie chart using recharts with legend and custom label
- React google maps draggable marker example
- React datepicker using the most popular react-datepicker library
- React toast notification using react-toastify with example
- React responsive carousel slider with react-slick
- React tooltip using rc-tooltip with example
- React hook form schema validation using yup